Introduction to Data Visualization with Python
Chapter 2 : Plotting 2D arrays
Generating meshes
This will create two arrays with a shape of (20,10), which corresponds to 20 rows along the Y-axis and 10 columns along the X-axis. In this exercise, you will use np.meshgrid() to generate a regular 2-D sampling of a mathematical function.
Y,X = np.meshgrid(range(10),range(20))
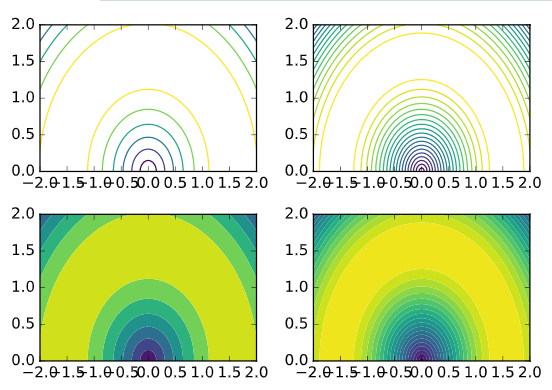
Contour & filled contour plots
# Generate a default contour map of the array Z
plt.subplot(2,2,1)
plt.contour(X, Y, Z)

# Generate a contour map with 20 contours
plt.subplot(2,2,2)
plt.contour(X, Y, Z, 20)

# Generate a default filled contour map of the array Z
plt.subplot(2,2,3)
plt.contourf(X, Y, Z)

# Generate a default filled contour map with 20 contours
plt.subplot(2,2,4)
plt.contourf(X, Y, Z, 20)

# Improve the spacing between subplots
plt.tight_layout()

# Display the figure
plt.show()
###
# Generate a 2-D histogram
plt.hist2d(hp, mpg, bins=(20,20),
           range=((40,235), (8, 48)))

# Add a color bar to the histogram
plt.colorbar()
###
# Generate a 2d histogram with hexagonal bins
plt.hexbin(hp, mpg, gridsize=(15,12),
           extent=(40,235,8, 48))

# Add a color bar to the histogram
plt.colorbar()
Loading, examining images
# Load the image into an array: img
img = plt.imread('480px-Astronaut-EVA.jpg')

# Print the shape of the image
print(img.shape)

# Display the image
plt.imshow(img)

# Hide the axes
plt.axis('off')
plt.show()
Pseudocolor plot from image data
# Load the image into an array: img
img = plt.imread('480px-Astronaut-EVA.jpg')

# Print the shape of the image
print(img.shape)

# Compute the sum of the red, green and blue channels: intensity
intensity = img.sum(axis=2)

# Print the shape of the intensity
print(intensity.shape)

# Display the intensity with a colormap of 'gray'
plt.imshow(intensity, cmap='gray')

# Add a colorbar
plt.colorbar()

# Hide the axes and show the figure
plt.axis('off')
plt.show()
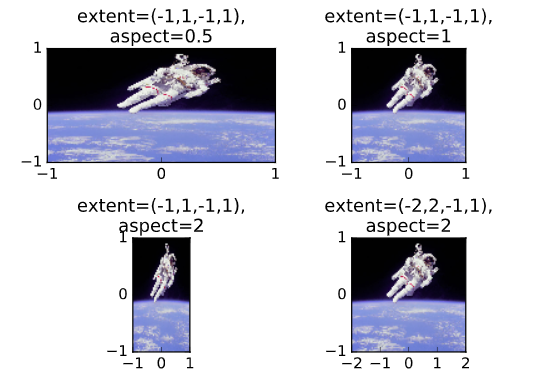
Extent and aspect
# Load the image into an array: img
img = plt.imread('480px-Astronaut-EVA.jpg')

# Specify the extent and aspect ratio of the top left subplot
plt.subplot(2,2,1)
plt.title('extent=(-1,1,-1,1),\naspect=0.5')
plt.xticks([-1,0,1])
plt.yticks([-1,0,1])
plt.imshow(img, extent=(-1,1,-1,1), aspect=0.5)

# Specify the extent and aspect ratio of the top right subplot
plt.subplot(2,2,2)
plt.title('extent=(-1,1,-1,1),\naspect=1')
plt.xticks([-1,0,1])
plt.yticks([-1,0,1])
plt.imshow(img, extent=(-1,1,-1,1), aspect=1)

# Specify the extent and aspect ratio of the bottom left subplot
plt.subplot(2,2,3)
plt.title('extent=(-1,1,-1,1),\naspect=2')
plt.xticks([-1,0,1])
plt.yticks([-1,0,1])
plt.imshow(img, extent=(-1,1,-1,1), aspect=2)

# Specify the extent and aspect ratio of the bottom right subplot
plt.subplot(2,2,4)
plt.title('extent=(-2,2,-1,1),\naspect=2')
plt.xticks([-2,-1,0,1,2])
plt.yticks([-1,0,1])
plt.imshow(img, extent=(-2,2,-1,1), aspect=2)

# Improve spacing and display the figure
plt.tight_layout()
plt.show()
Rescaling pixel intensities
# Load the image into an array: image
image = plt.imread('640px-Unequalized_Hawkes_Bay_NZ.jpg')

# Extract minimum and maximum values from the image: pmin, pmax
pmin, pmax = image.min(), image.max()
print("The smallest & largest pixel intensities are %d & %d." % (pmin, pmax))

# Rescale the pixels: rescaled_image
rescaled_image = 256*(image - pmin) / (pmax - pmin)
print("The rescaled smallest & largest pixel intensities are %.1f & %.1f." %
      (rescaled_image.min(), rescaled_image.max()))

# Display the original image in the top subplot
plt.subplot(2,1,1)
plt.title('original image')
plt.axis('off')
plt.imshow(image)

# Display the rescaled image in the bottom subplot
plt.subplot(2,1,2)
plt.title('rescaled image')
plt.axis('off')
plt.imshow(rescaled_image)

plt.show()
The smallest & largest pixel intensities are 104 & 230. The rescaled smallest & largest pixel intensities are 0.0 & 256.0.

